Calculate
TCO savings
Compare Elonroad with diesel and standard plug-in charging over the full project lifetime.
Vehicle type
Charging configuration
Region
Number of vehicles20 vehicles
Operating hours per day16 h
Operating days per week6 days
Your savings over 10 years
Savings vs diesel€8.53M47% lower TCO · Payback in 1.6 years
Savings vs standard charging€1.40M13% lower TCO · Immediate payback
CO₂ avoided vs diesel26 757 t2 676 tonnes per year
This is an estimate. Your inputs follow you to the form so we can tailor it to your site.
Contact us for a customised calculationCost breakdown
Fleet total over 10 years in present value, discounted at 10%. Energy, diesel and carbon prices escalate yearly.
Diesel
€18.0M
Standard charging
€10.9M
Elonroad Static
€9.49M
CapexEnergyOperating costsCarbon
System sizing
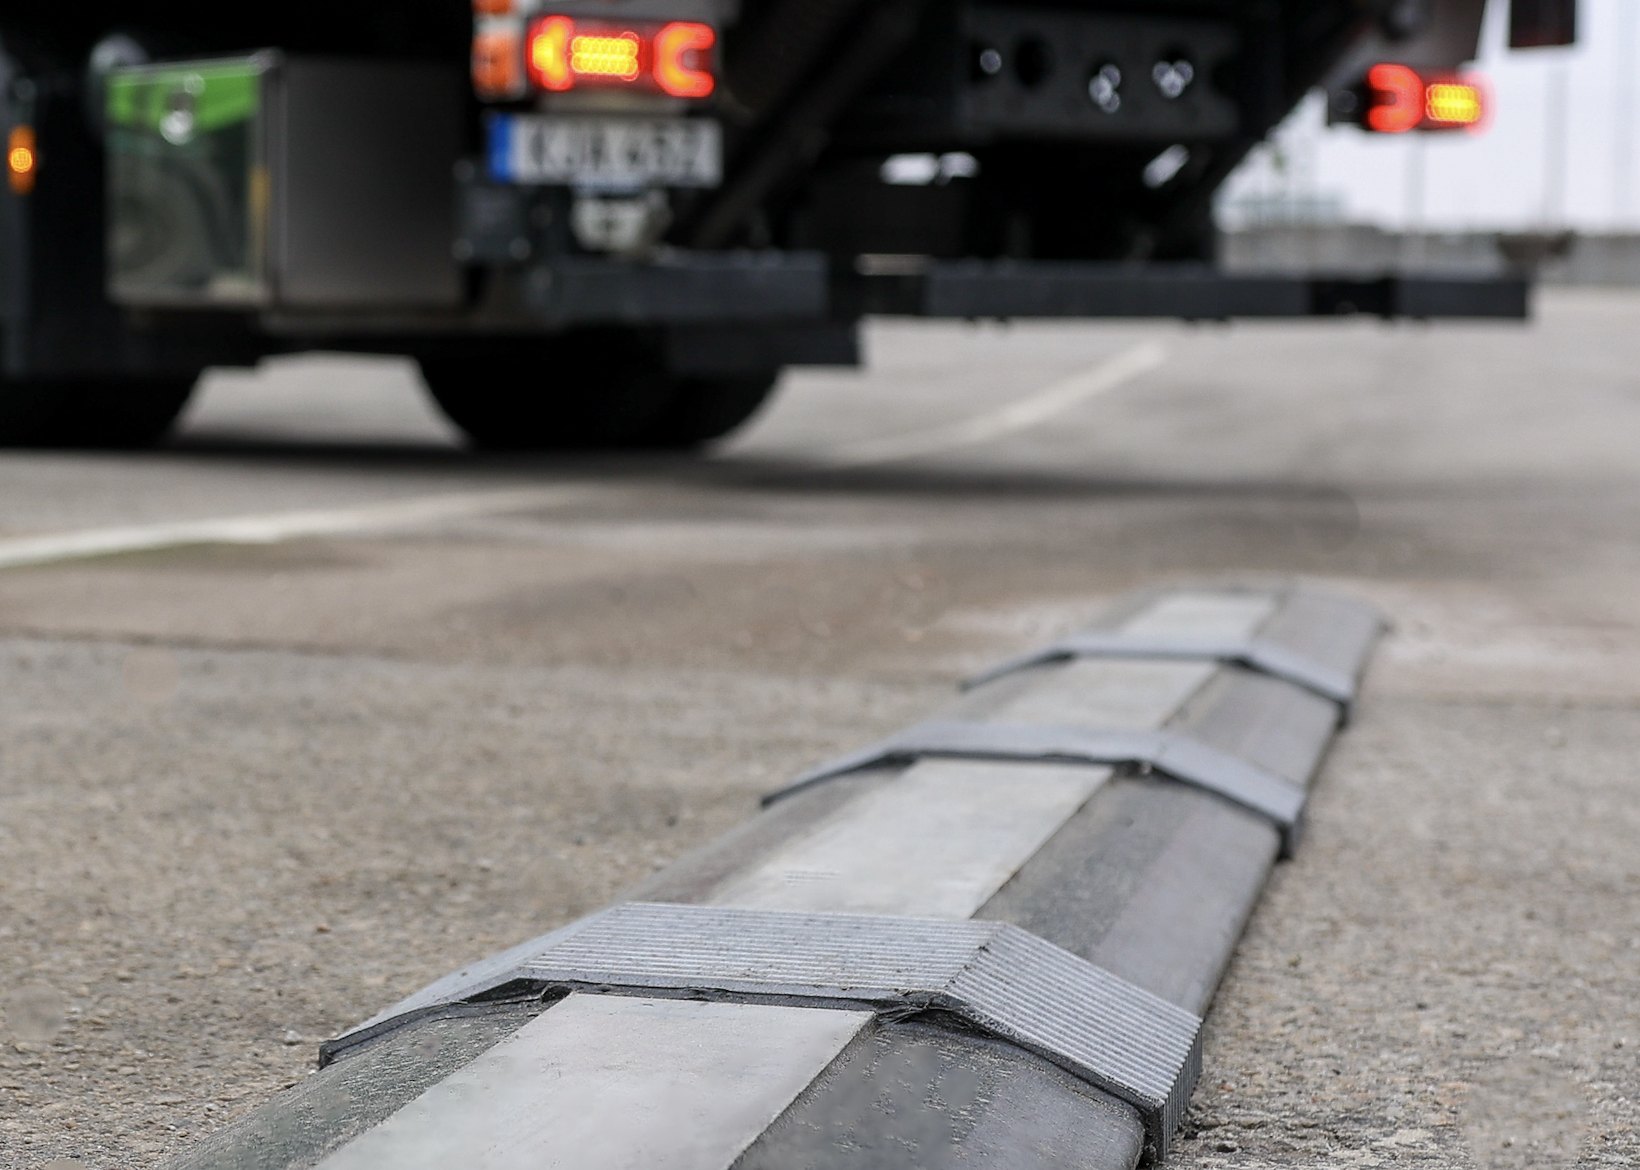
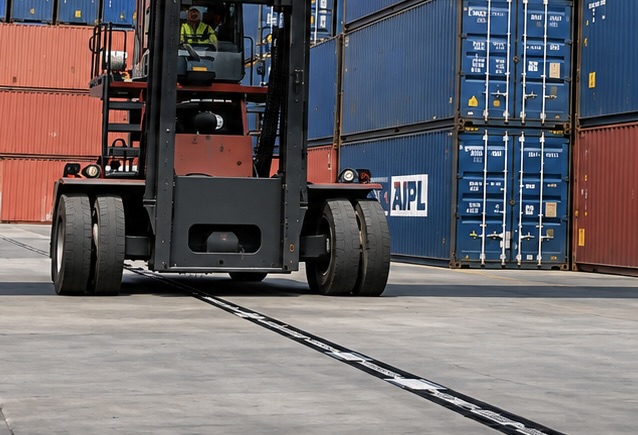
6Static charging rails (3.8 vehicles per rail, logistics-limited)
23Vehicles needed with standard charging (12% buffer for charging downtime)
840 kgPayload gain per vehicle from a smaller battery
6.7 yrsBattery life with Elonroad (6.7 yrs standard)
Assumptions and sources
These are the values behind every result above. They are fixed, so every visitor sees the same comparable baseline.
Energy prices by region
- Europe
- €0.29/kWh · €1.93/L diesel · €75/t CO₂
- Nordics
- €0.09/kWh · €1.80/L diesel · €75/t CO₂
- USA
- €0.16/kWh · €1.25/L diesel · no carbon price
Vehicles
- Terminal tractor
- 15 kWh/h · battery 210 kWh standard, 105 kWh Elonroad · €200 000 electric, €70 000 diesel · 10 L/h diesel
- Reachstacker
- 40 kWh/h · battery 587 kWh standard, 407 kWh Elonroad · €750 000 electric, €420 000 diesel · 17 L/h diesel
Batteries
- Battery price and weight
- €100/kWh · 8 kg/kWh
- Standard charging
- 80% depth of discharge · 3 000 cycles
- Elonroad
- 30% depth of discharge · 16 000 cycles
Charging infrastructure
- Standard charger
- €40 000 hardware + €15 000 installation · €2 000/yr maintenance · 4 vehicles per charger · 52 m²
- Elonroad dynamic
- 350 kW power stations · 9.2 m rail segments · 10% sizing margin
- Elonroad static
- 300 kW · 5 min charge per 25 min cycle · 30 m² · €2 800/yr maintenance
- Diesel fuelling
- €100 000 station + €20 000 installation · 20 vehicles per station
Operating costs per vehicle and year
- Diesel
- €5 000 maintenance · €4 000 tyres · €6 000 insurance · €3 000 other
- Electric
- €5 000 maintenance · €5 000 tyres · €6 500 insurance · €3 000 other
- Land
- €13/m² per year · driver cost €20/h is not included
Finance and emissions
- Defaults
- 10-year lifetime · 10% discount rate · 52 weeks per year
- Yearly price increase
- Electricity 2% · diesel 2% · carbon 5%
- Emissions
- 2.68 kg CO₂ per litre of diesel
- Currency
- Costs are modelled in EUR; USA results are shown in USD at 1.08
Sources
Elonroad system prices, installation costs and sizing rules come from Elonroad's own TCO model and project data. Market prices, battery costs, emissions and vehicle data can be checked against these public sources.
- Elonroad systemElonroad TCO model: system pricing, installation, sizing and project data
- Electricity, EuropeEurostat – Electricity price statistics, non-household consumers
- Diesel, EuropeEuropean Commission – Weekly Oil Bulletin
- Electricity, USAU.S. Energy Information Administration – Electric Power Monthly
- Diesel, USAU.S. Energy Information Administration – Gasoline and Diesel Fuel Update
- Carbon priceEuropean Commission – EU Emissions Trading System (EU ETS)
- Battery priceBloombergNEF – Lithium-Ion Battery Price Survey 2025
- CO₂ per litreUK Government – Greenhouse gas conversion factors for company reporting
- Port vehiclesPorts of Los Angeles and Long Beach – Cargo-handling equipment feasibility assessments
Results are indicative and intended for early-stage feasibility assessment. Actual figures depend on site-specific conditions.